Anyone who creates content for a living knows the importance of email as a distribution and marketing channel. And as far as email marketing tools go, Mailchimp is the 1000 pound gorilla. Although Mailchimp has some of the most complete features for sending emails, they have historically lagged behind in terms of native analytics features.
One way around this limitation is to import Mailchimp analytics data into a data visualization tool like Google Looker Studio. Not only does this extend what you can do with Mailchimp analytics, it also allows you to combine your email marketing analytics together with web analytics, memberships, your content management system (CMS) and any other data that is important to your content creation and marketing efforts.
This is what we are trying to help content marketers and creators do at Epilocal. We are building a platform that makes it easier to bring together the data that you need across your entire content landscape.
In this guide, we will see step-by-step how you can connect Mailchimp to Looker Studio:
- First, we will look at how you can do this for free in a manual way
- Then we will look at an automated option that uses our platform
- Finally, we will look at what we can do with our Mailchimp data once we get it inside Looker Studio
Manually Connecting Mailchimp to Looker Studio
One convenient feature that Google Looker Studio has is the ability to upload files that contain data in CSV format. This offers a manual work-around for data sources that either don’t have a more automated way to connect to Looker Studio or that you prefer to upload manually for one reason or another.
One advantage of this manual way to connect Mailchimp to Looker Studio is that it is 100% free. The downsides are that it won’t refresh data automatically, is limited in terms of the data that is available, and will require regular manual effort on your part.
With that being said, let’s see how we can manually connect our Mailchimp data to Looker Studio.
First, we will start in our Mailchimp dashboard and go to ‘Analytics’.
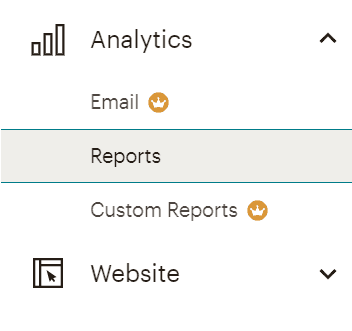
From here we will click Reports, then we will click the button that says ‘Download All Reports’.

Then click ‘Generate Report’, which will trigger a CSV report to be generated with all of your Mailchimp campaign reports. When this is ready, it will be sent to you by email.
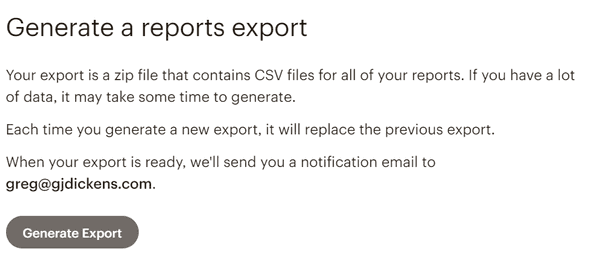
Once you’ve downloaded and unzipped your data, we will have a CSV file that we can upload to Google Looker Studio. First let’s have a look inside and see what our data looks like.

To upload this file in Looker Studio, we will go to ‘Add New Data Source’ and select the ‘File Upload’ option.
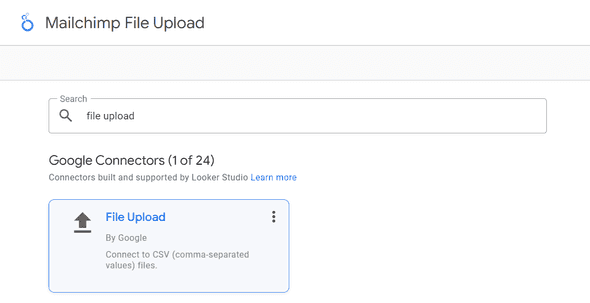
We’ve created a special free template for using this File Upload approach that maps to the field names that appear in the Mailchimp CSV export.
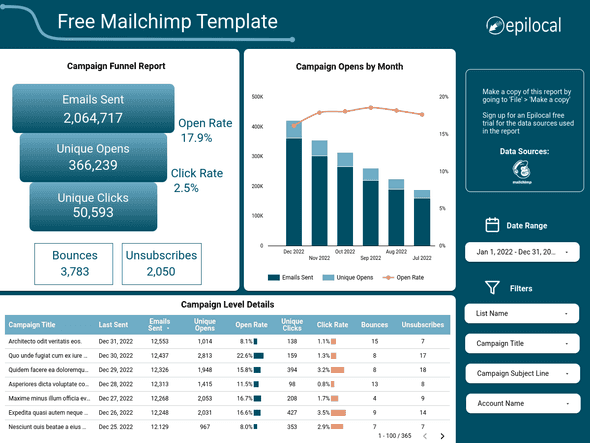
You can grab it here and use it to get started by simply making a copy in Looker Studio and using your own uploaded file as the data source -> Free Mailchimp File Upload Template.
Disadvantages of Manually Connecting Mailchimp to Looker Studio
Although this manual approach to connect Mailchimp to Looker Studio works to create some useful reports and is 100% free, it has disadvantages.
First, you are limited with the data fields available. You will only have access to the fields that show up in the Mailchimp CSV export. These fields are not configurable and you have no way to add additional fields. (To get an idea of other Mailchimp fields available, you can check out the field reference for our Mailchimp Looker Studio connector)
Second, once you have uploaded your CSV file, your data is fixed. That means, that if you want to have a weekly view of your Mailchimp campaigns, you will need to repeat this manual process every week.
Finally, there are some gotchas to be aware of in Looker Studio that may make your File Upload experience more complicated and frustrating than you might have thought. This arises from the fact that Looker Studio can be very strict about the format that data needs to be in for it to be parsed correctly. In our case, the ‘Sent Date’ field actually needs to be reformatted in order to be processed as a date by Looker Studio.
To do this, you need to use the TEXT() formula in Excel or Google Sheets and format the text as ‘YYYYMMDD’. (this is the format that Looker Studio expects dates to be in) Once you’ve applied this formula to all of the rows in your Sent Date column, you will then need to copy and paste these cells as values.
Depending on your situation, it may not be the best use of your time to be processing and uploading data manually to Looker Studio or you may need access to additional data fields. In these cases it makes sense to use a Looker Studio connector.
Mailchimp Looker Studio Connectors
A Looker Studio connector is essentially a small software service that connects to a data source’s API (in this case Mailchimp) and pulls that data into a Google Looker Studio report based on whatever fields the user selects.
By default, Google provides a handful of connectors that allow you to bring in data - some examples of these are Google Analytics, Google Sheets and the File Upload option that we used in our manual approach.
Beyond the limited connectors provided by Google, there are also Partner Connectors which are built either directly by the company that has the data source or by companies that connect multiple platforms to Looker Studio.
You can browse all of the different Partner connectors for Google Looker Studio in their connector gallery.
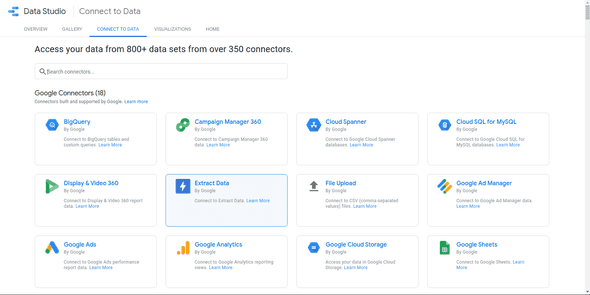
For the purposes of our guide, we will be using our own Mailchimp Connector for Looker Studio.
How to Connect Mailchimp to Looker Studio Automatically
In order to connect Mailchimp to Looker Studio using our connector, you will first need to sign up for a free trial.
Once you’ve done that, you will see a dashboard where you can add data sources by linking your various accounts.
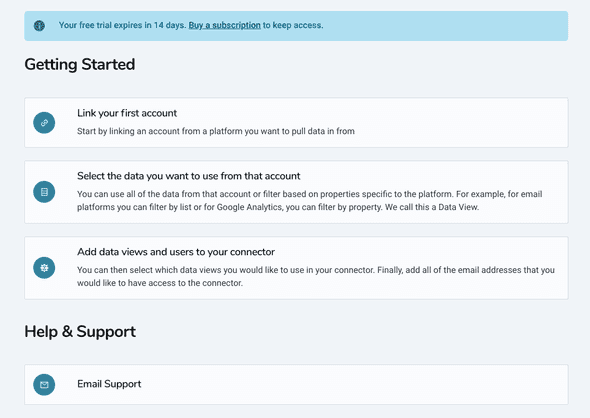
In order to link your Mailchimp account, you simply need to follow the prompts and enter your Mailchimp username and password.
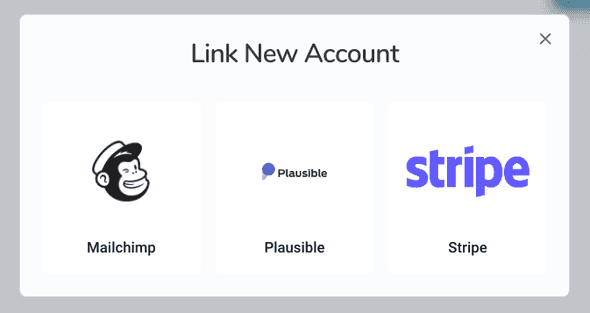
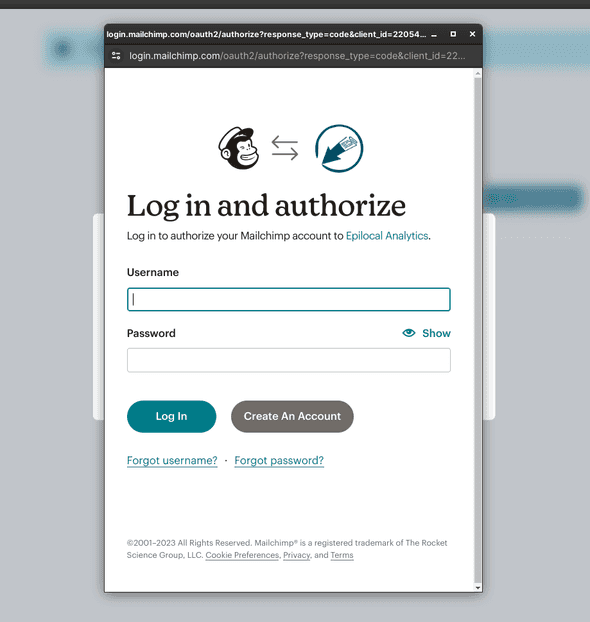
Once you’ve done that, if you go to Use Data > Connectors, you will see that the Mailchimp Looker Studio connector is now active.
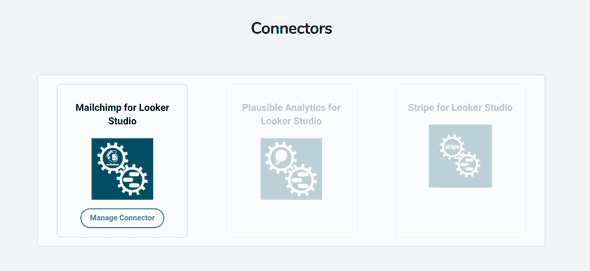
One last step, before you move over to Looker Studio, is to make sure that the Google email address you use to access Looker Studio is added as a connector user. You can do this by clicking on ‘Manage Connector’ and ‘Users’.

Then over in Looker Studio, you simply need to create a new data source in Looker Studio using our Mailchimp Connector. You can do this by following this link or by searching for Epilocal in the Looker Studio connector gallery.
Once you authorize the connector by logging into your Google account, you will see drop-down lists that prompt you to select your Data Type and Data View.
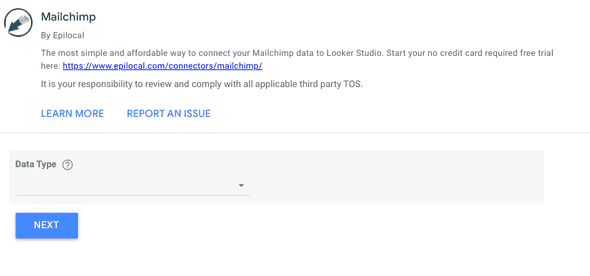
Under Data Type, we will select ‘Campaigns’ and under Data View we will select the Mailchimp account that we just linked over in the Epilocal dashboard.
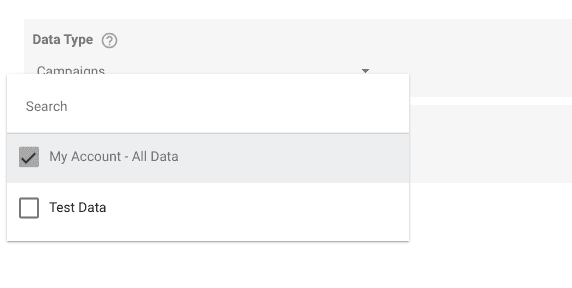
Then we just need to follow the remaining prompts and we will have our Mailchimp data available to us in Looker Studio. The best part is that this connection will automatically update as we have new data in Mailchimp.
If you want to get started right away with a template, you make a copy of our Free Mailchimp Campaigns template and simply select your newly added Data Source when prompted by Looker Studio. (this is the same template as in the manual approach, with the only difference being that the data fields have different names to accommodate the connector as opposed to the headers in the CSV export file)
Using Mailchimp Data in Looker Studio
Now that we have our Mailchimp account connected to Looker Studio, let’s see how we can use that data to create custom reports. To do this we will look at some of the details behind our free template.
First, let’s look at the funnel in the top-left side of our report.
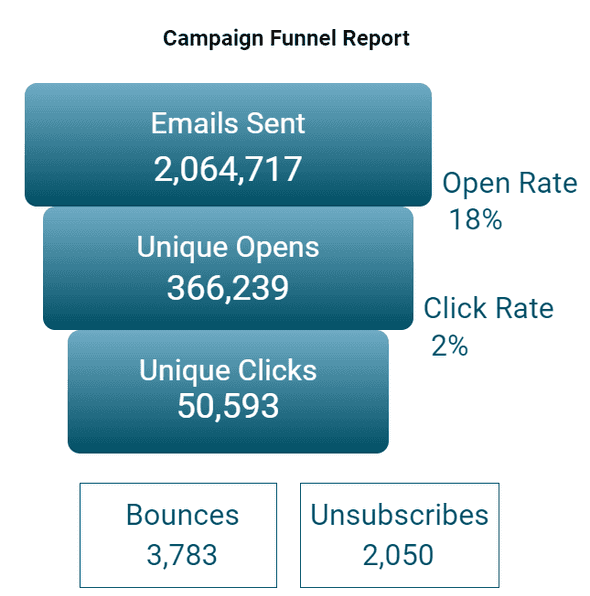
This is created by combining the Scorecard element with shapes and text elements. For example, the Emails Sent box at the top is created in three steps:
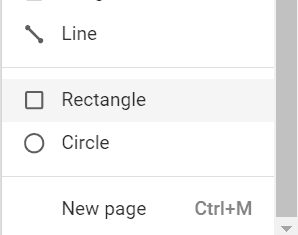
- Create a shape by going to Insert > Rectangle and styling it to your liking
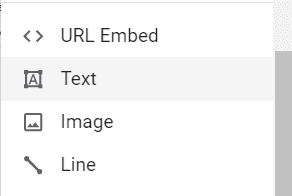
- Then we are adding a text field by going to Insert > Text and typing the text ‘Emails Sent’
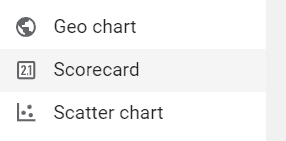
- Finally, we are using a Scorecard metric to display our actual metric from Mailchimp. You can create this by going to Insert > Scorecard.
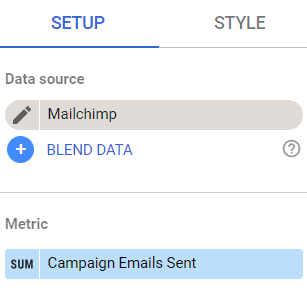
Then in the right-hand toolbar under Setup, you will select the metric ‘Campaign Emails Sent’.
All of the other metrics in this funnel are pretty straightforward, the only difference being how the rectangle shape is styled and what metric is used. For each of the following metrics, we used the following fields from our connector:
- Unique Opens -> Campaign Unique Opens
- Unique Clicks -> Campaign Unique Clicks
- Bounces -> Campaign Total Bounces
- Unsubscribes -> Campaign Unsubscribes
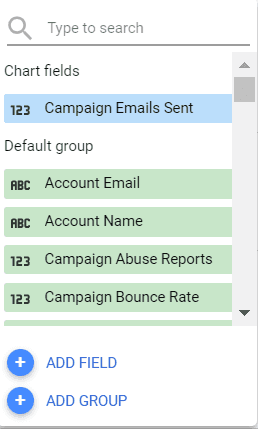
The percentages are slightly different, in that we used a custom field to create them. You can create a custom field by clicking on the metric in your Scorecard and selecting ‘Add Field’.
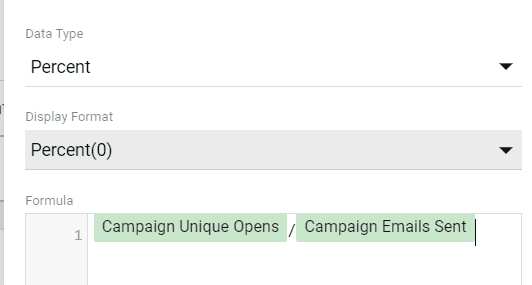
Then we are simply dividing either ‘Campaign Unique Opens’ or ‘Campaign Unique Clicks’ by ‘Campaign Emails Sent’ and selecting ‘Percent’ under Data Type.
Next, let’s look at the table at the bottom of our report.

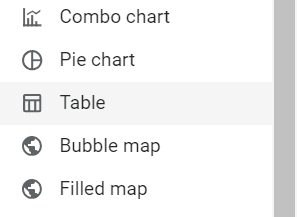
To create this, we simply need to go to Insert > Table.
Then in the Setup sidebar on the right, we just need to add all of our Dimensions and Metrics which are:
- Campaign Title (Dimension)
- Campaign Last Sent (Dimension)
- Campaign Emails Sent (Metric)
- Campaign Unique Opens (Metric)
- Campaign Unique Open Rate (Metric)
- Campaign Unique Clicks (Metric)
- Campaign Unique Click Rate (Metric)
- Campaign Total Bounces (Metric)
- Campaign Unsubscribes (Metric)
Once you’ve added all of these, it will look like this:
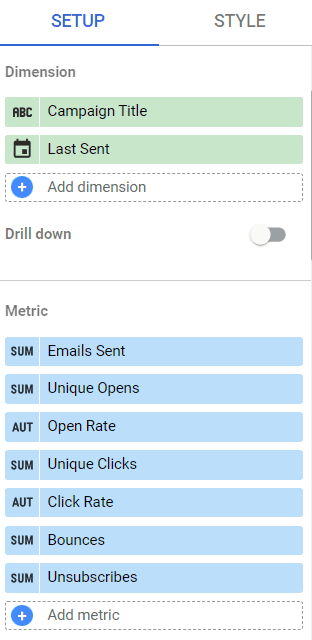
Note: We’ve shortened the names of the fields so they are cleaner to read on our table. You can rename each field by clicking on the left part of the field where it says ‘SUM’, ‘AUT’, ‘ABC’, etc.
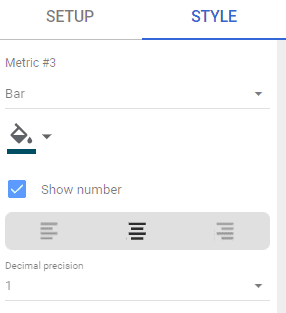
To add the bars inside the table for the Open Rate and Click Rate we will simply go to the Styles section in the right-hand toolbar and under Metric #3 and Metric #5 we will select ‘Bar’ instead of ‘Number’.
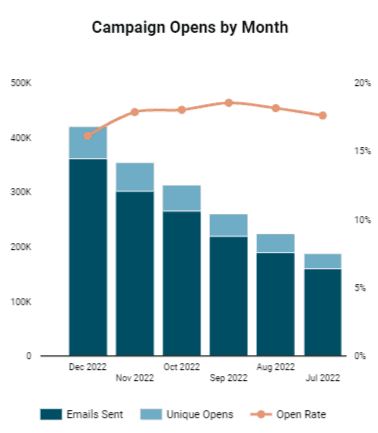
Finally, let’s look at how we can create the chart in our Mailchimp Campaigns template report.
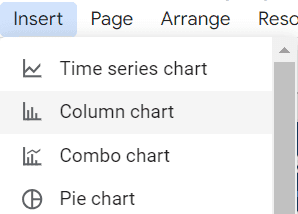
First, we will create our chart by going to Insert > Column Chart.
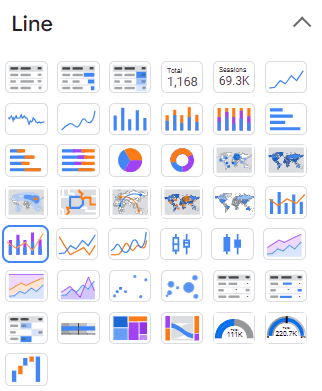
Next, we will go to the right-hand sidebar and change our chart to the type ‘Stacked Combo’.
Next, we will configure our chart metrics and dimensions in the right-hand sidebar under Setup. Under Dimensions, we will select ‘Campaign Last Sent’ and then we will click on the left part of the field so we can change the formatting. We will then select Date & Time > Year Month.
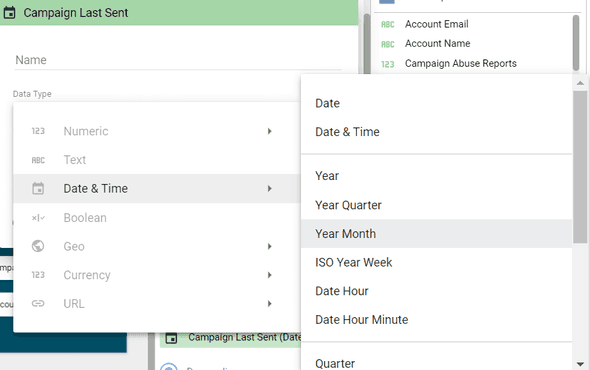
This will group our data by month instead of by individual campaign sent dates. Once we have done that, we simply need to add our metrics which are:
- Campaign Emails Sent
- Campaign Unique Opens
- Campaign Unique Open Rate
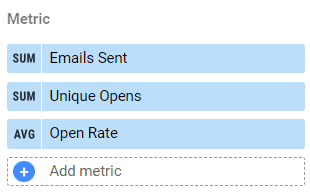
Note: again here we’ve renamed our metrics so they display better in our chart. You can rename the metrics by clicking to the left part of the field.
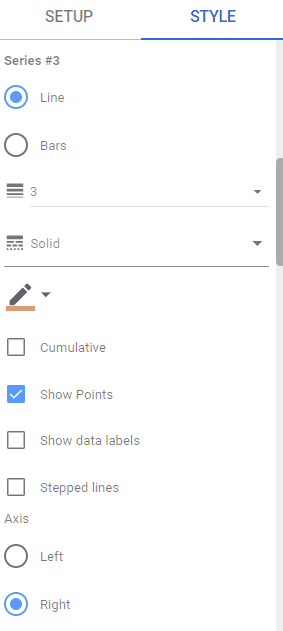
Finally, we just need to turn our ‘Open Rate’ series into a line. We can do this by selecting the Style from the right-hand toolbar and changing the following options under Series #3:
- Select ‘Line’ instead of ‘Bar’
- Check ‘Show Points’
- Select ‘Right Axis’
And with that you have the key elements of our free Mailchimp Campaigns template. This just scratches the surface of what you can do with Mailchimp data inside of Looker Studio. To get more ideas, you can check out some of our other guides:
Wrapping Up
In this article we looked at:
- Manually connecting Mailchimp to Google Looker Studio
- Automatically connecting Mailchimp to Looker Studio using our connector
- The pros and cons of the manual and automated approaches for connecting Mailchimp to Looker Studio
- How you can use Mailchimp data in Looker Studio to create custom charts, tables and dashboards
We hope that you found this guide useful. Here are the links to the free templates one more time:


